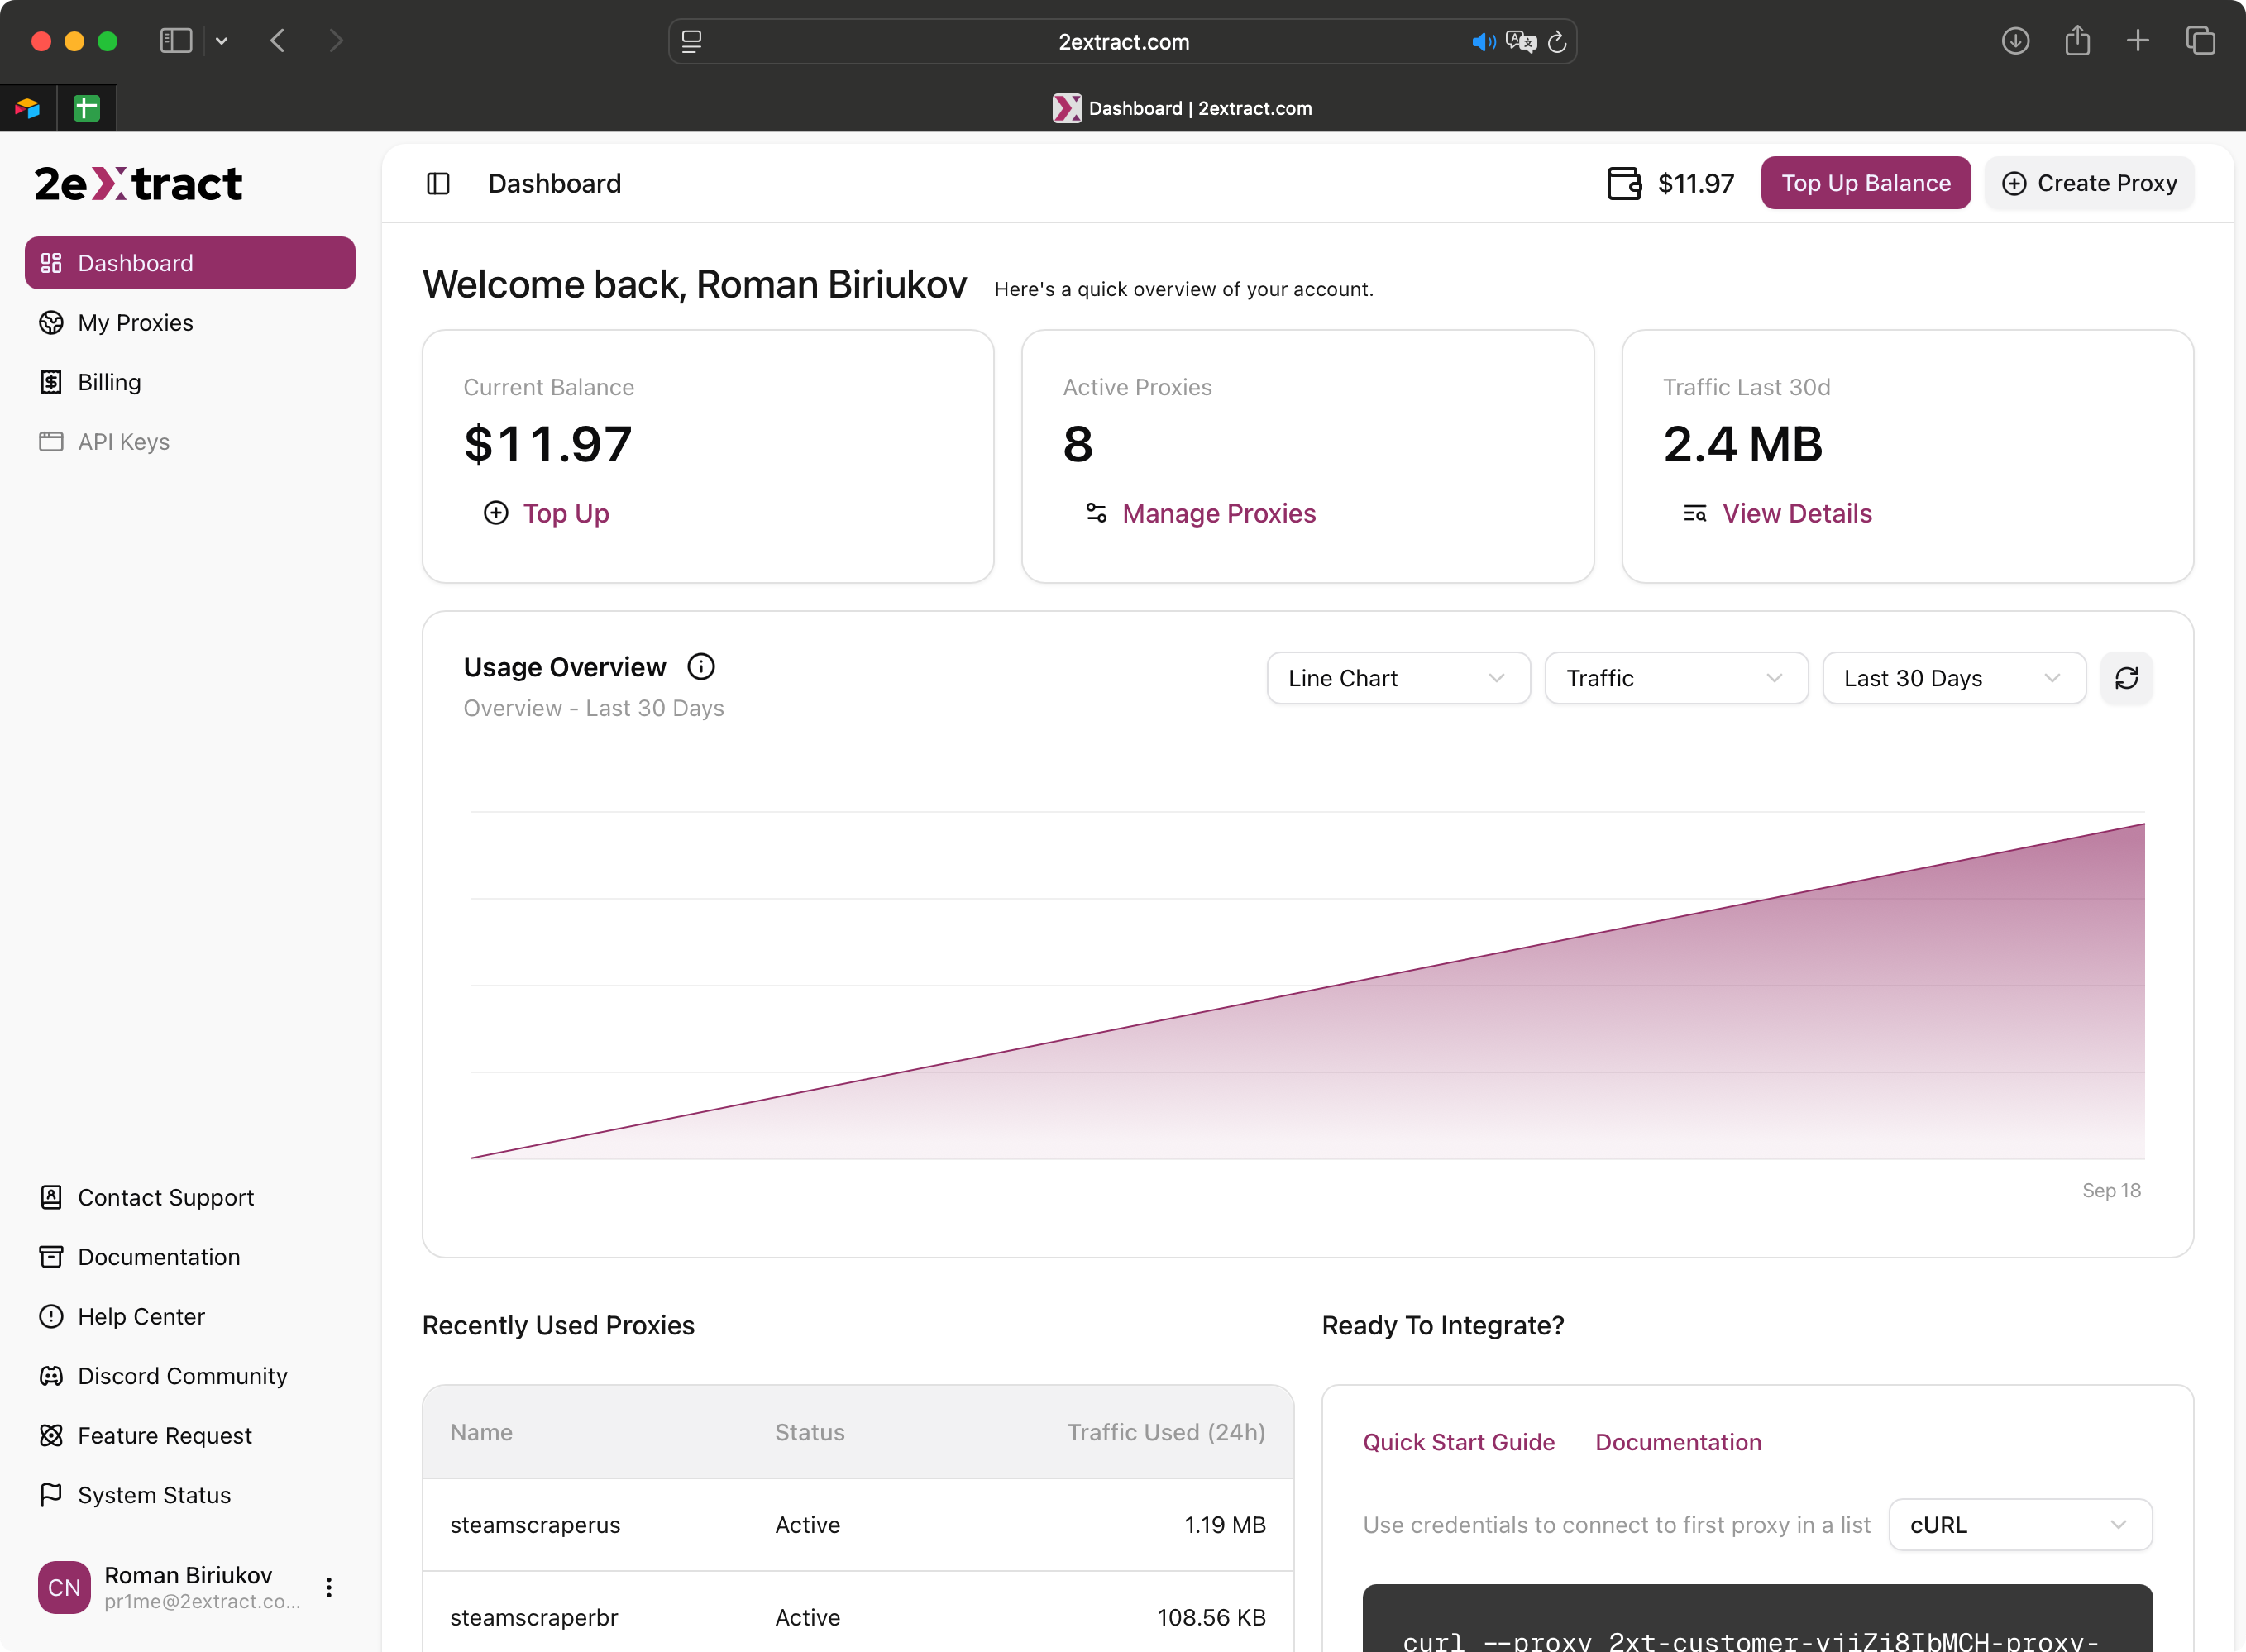
The main view of the 2extract.com Dashboard.
1. Header Zone
The top section of the dashboard provides a welcome message and your primary Call-to-Action (CTA).- Primary CTA Button: This button is smart! It changes based on your account’s status:
- If your balance is sufficient, it will show
+ Create Proxyto get you started quickly - If your balance is low or zero, it will change to
Top Up Balance, guiding you to the billing step
- If your balance is sufficient, it will show
2. Workspace Zone
This is the main area where you’ll find your key metrics and activity summaries.Account Status
This block gives you an instant snapshot of your account’s most important numbers. Each metric is a clickable link that takes you to the relevant management page.Current Balance
Shows your available funds for Pay-As-You-Go proxies. Click to go to the Billing page.
Active Proxies
The total number of proxies currently active on your account. Click to go to the My Proxies page.
Traffic (Last 30d)
Your total data usage across all proxies in the last 30 days. Click to scroll down to the detailed chart.
Usage Overview Chart
This chart visualizes your consumption over time.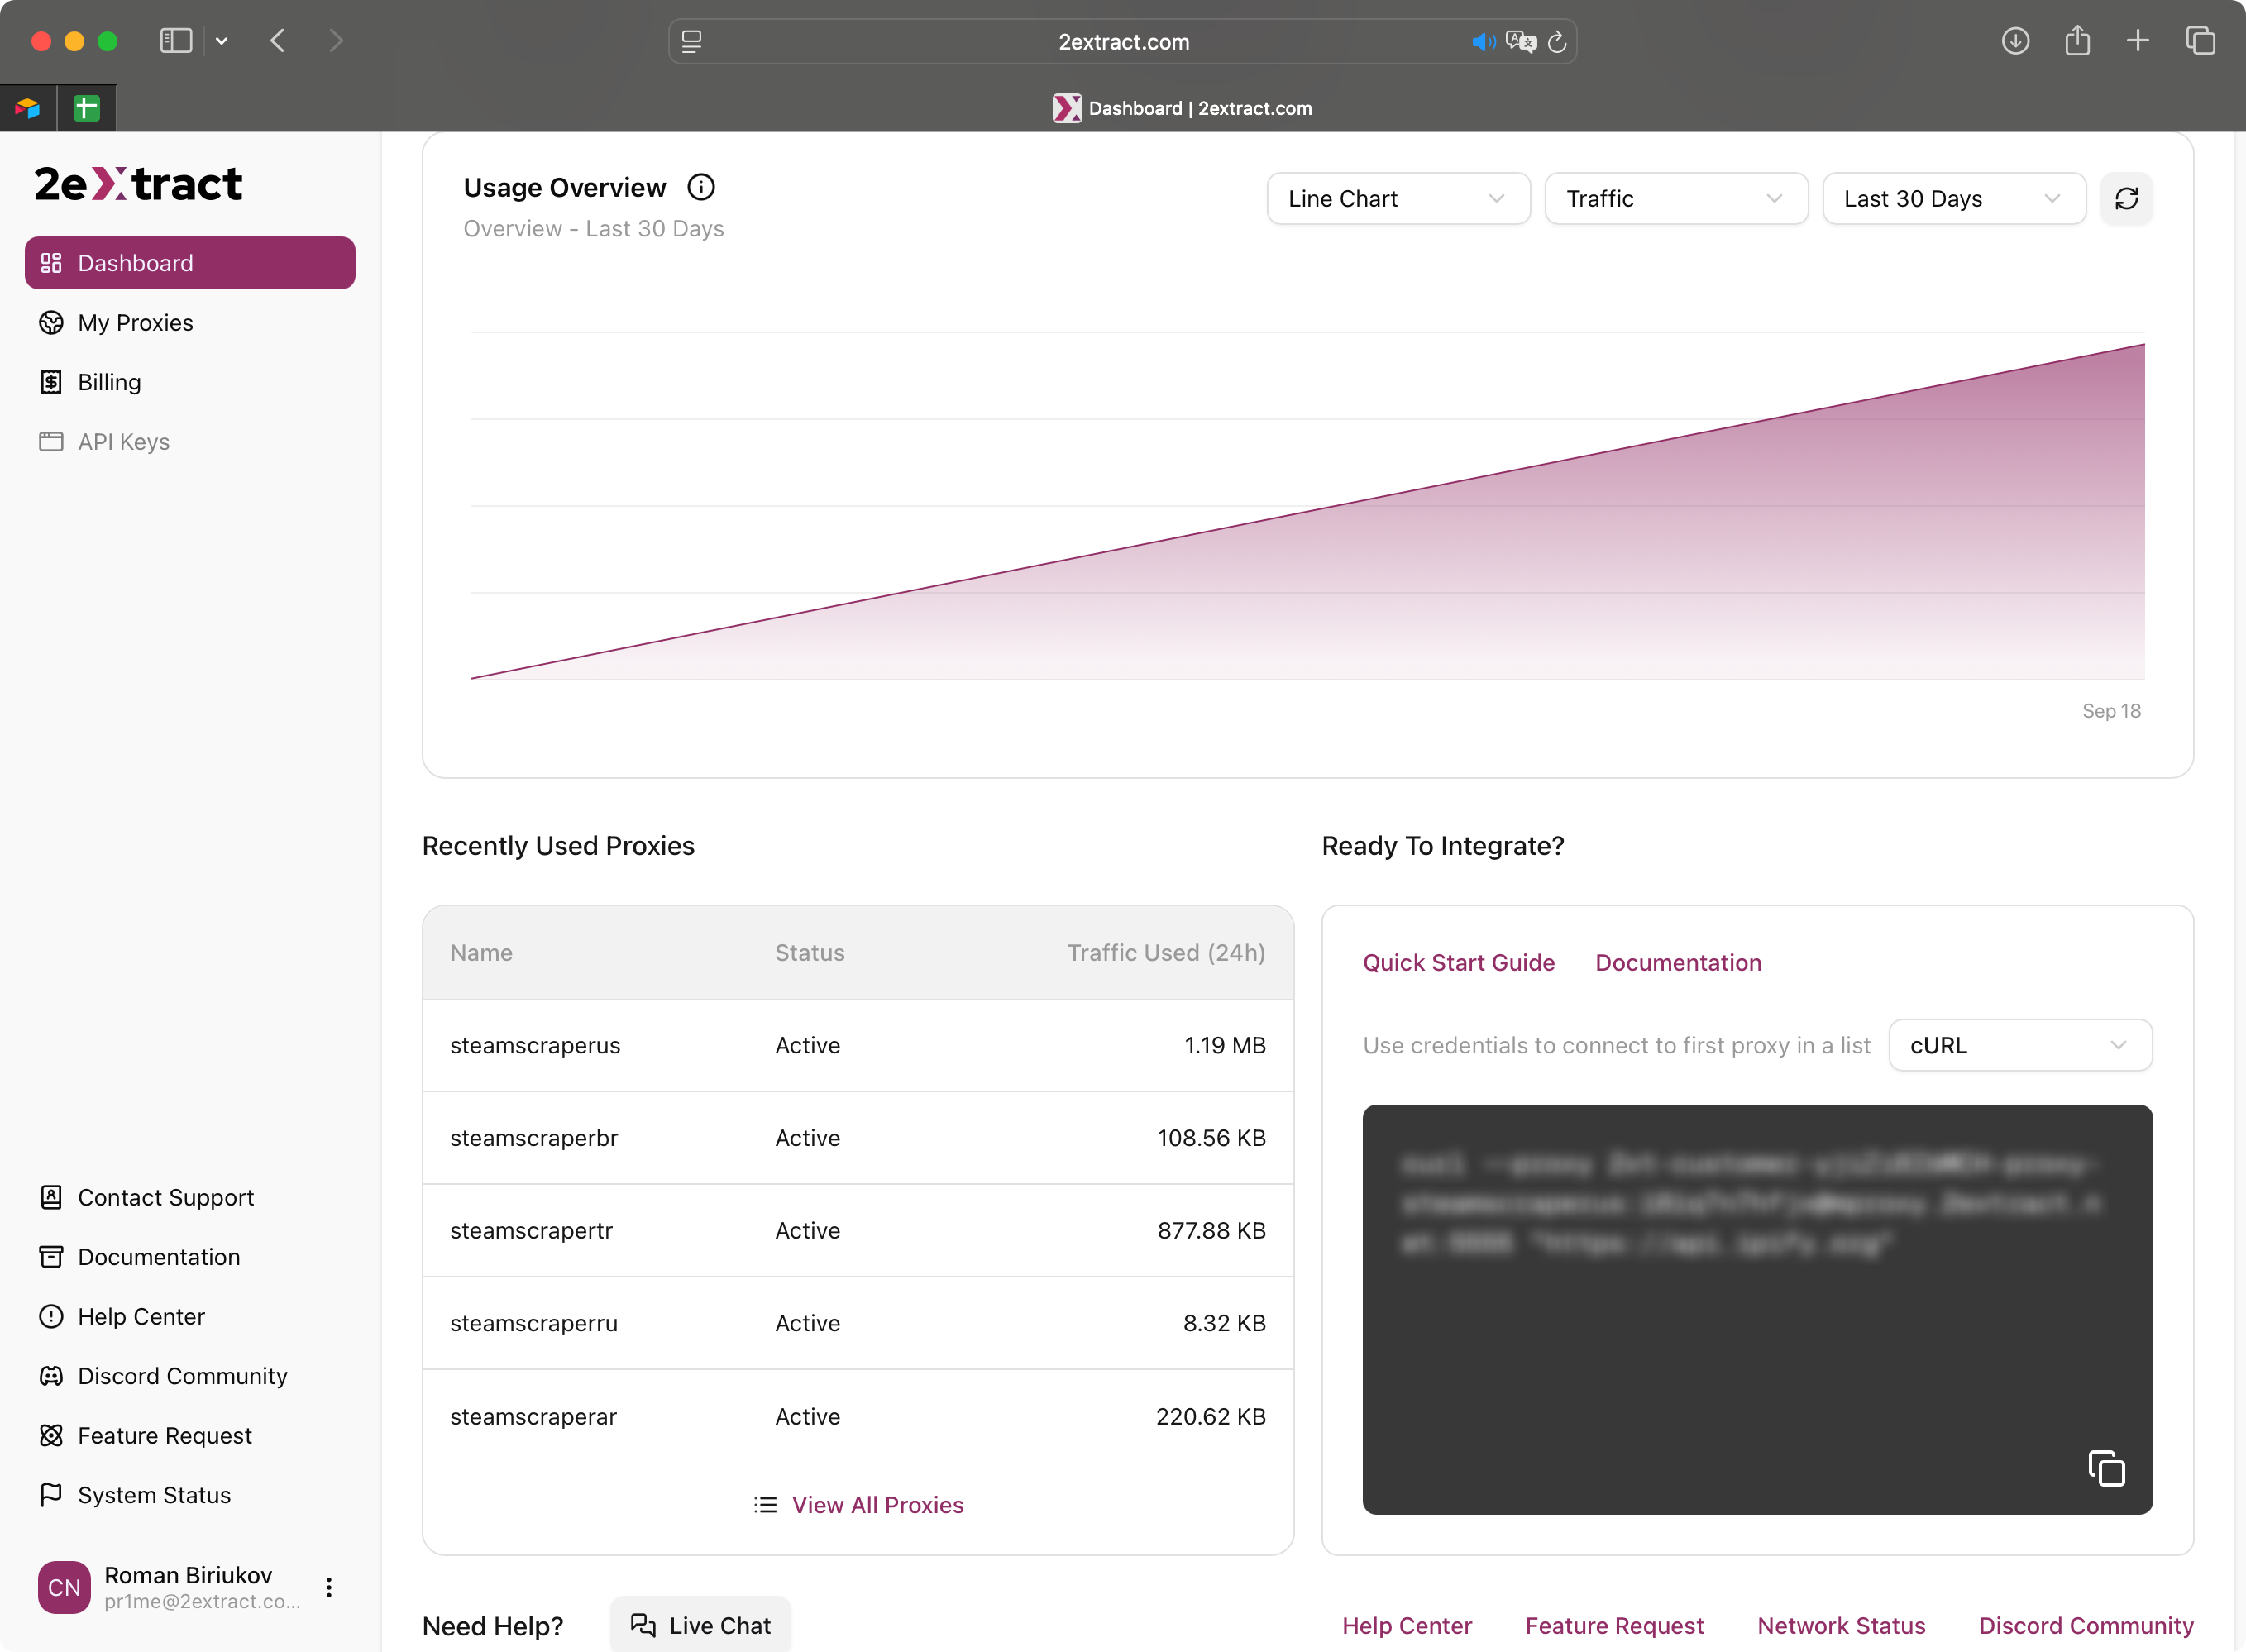
The Usage Overview chart with period and metric selectors.
- Metric Selector: Switch the view between
Traffic (GB)and totalRequests - Period Selector: Adjust the time range to see data for the
Last 7 Days,Last 30 Days, orLast 90 Days - Info Tooltip: Hover over the
(i)icon for a reminder that this chart shows total usage. For a per-proxy breakdown, you’ll need to view the statistics on the individual proxy’s settings page.
My Recent Proxies
This table provides quick access to your most recently used proxies, so you don’t have to search through the full list.- Columns: Shows the proxy
Name,Status, andTraffic Usedin the last 24 hours - Link: Use the
View All Proxies →link to navigate to the main “My Proxies” page
Quick Start & Integration
This block is designed to help you integrate our proxies into your tools as quickly as possible.- Links: Direct links to our Quick Start Guide and this Documentation
- Interactive Snippet: A ready-to-use code example for one of your active proxies. You can switch between languages like
cURL,Python, andNode.js, and copy the code with a single click